Vegetation contact causes more power outages than any other single factor. Utilities spend heavily to prevent it. Most still plan that spending from ground patrols, helicopter passes, and survey data that ages the moment it lands.
We built something better. One aerial pass over a corridor now produces three deliverables at once: a photoreal 3D record you can fly through, a labelled inventory of everything in the scene, and the distance from every conductor to the nearest vegetation, in metres.
What you are looking at
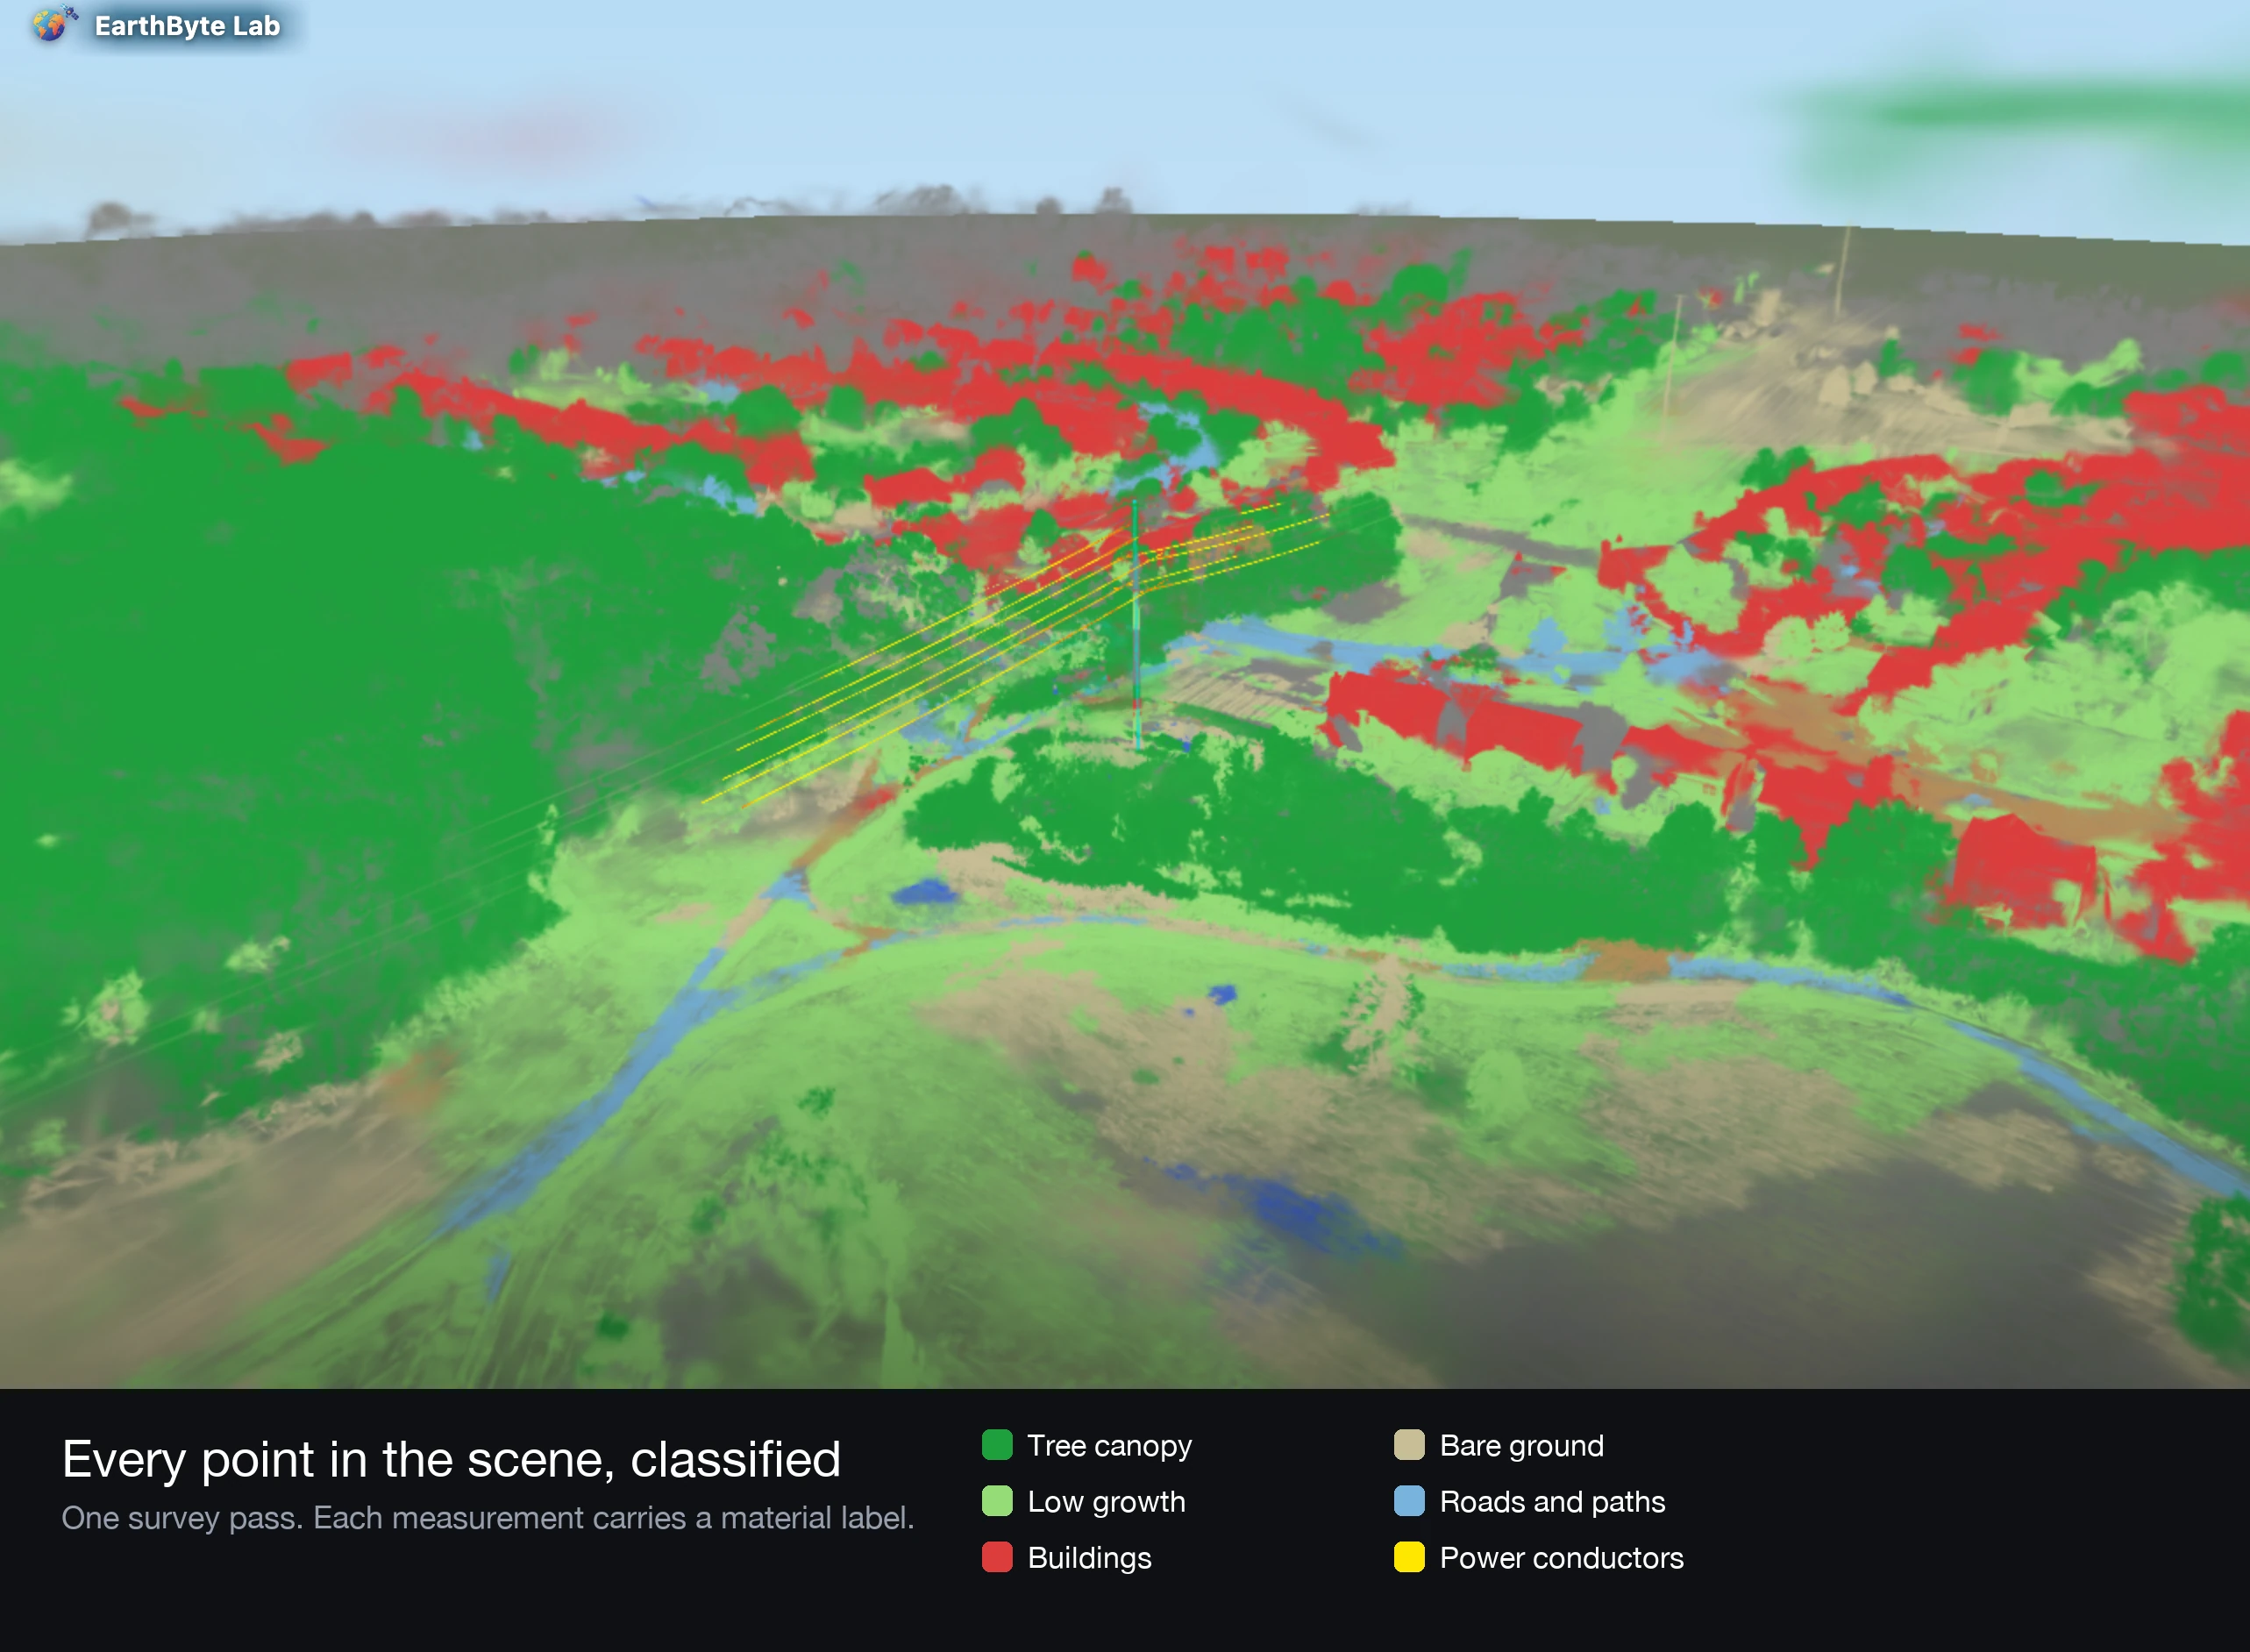
The image above is a real corridor. Every coloured point is a measurement carrying a material label. Dark green is tree canopy. Light green is low growth. Red is buildings. Tan is bare ground. Blue is roads and paths. Yellow is the power conductors themselves.
Nothing here was traced by hand. The scene was captured in a single flight and labelled automatically.
The same survey, two views
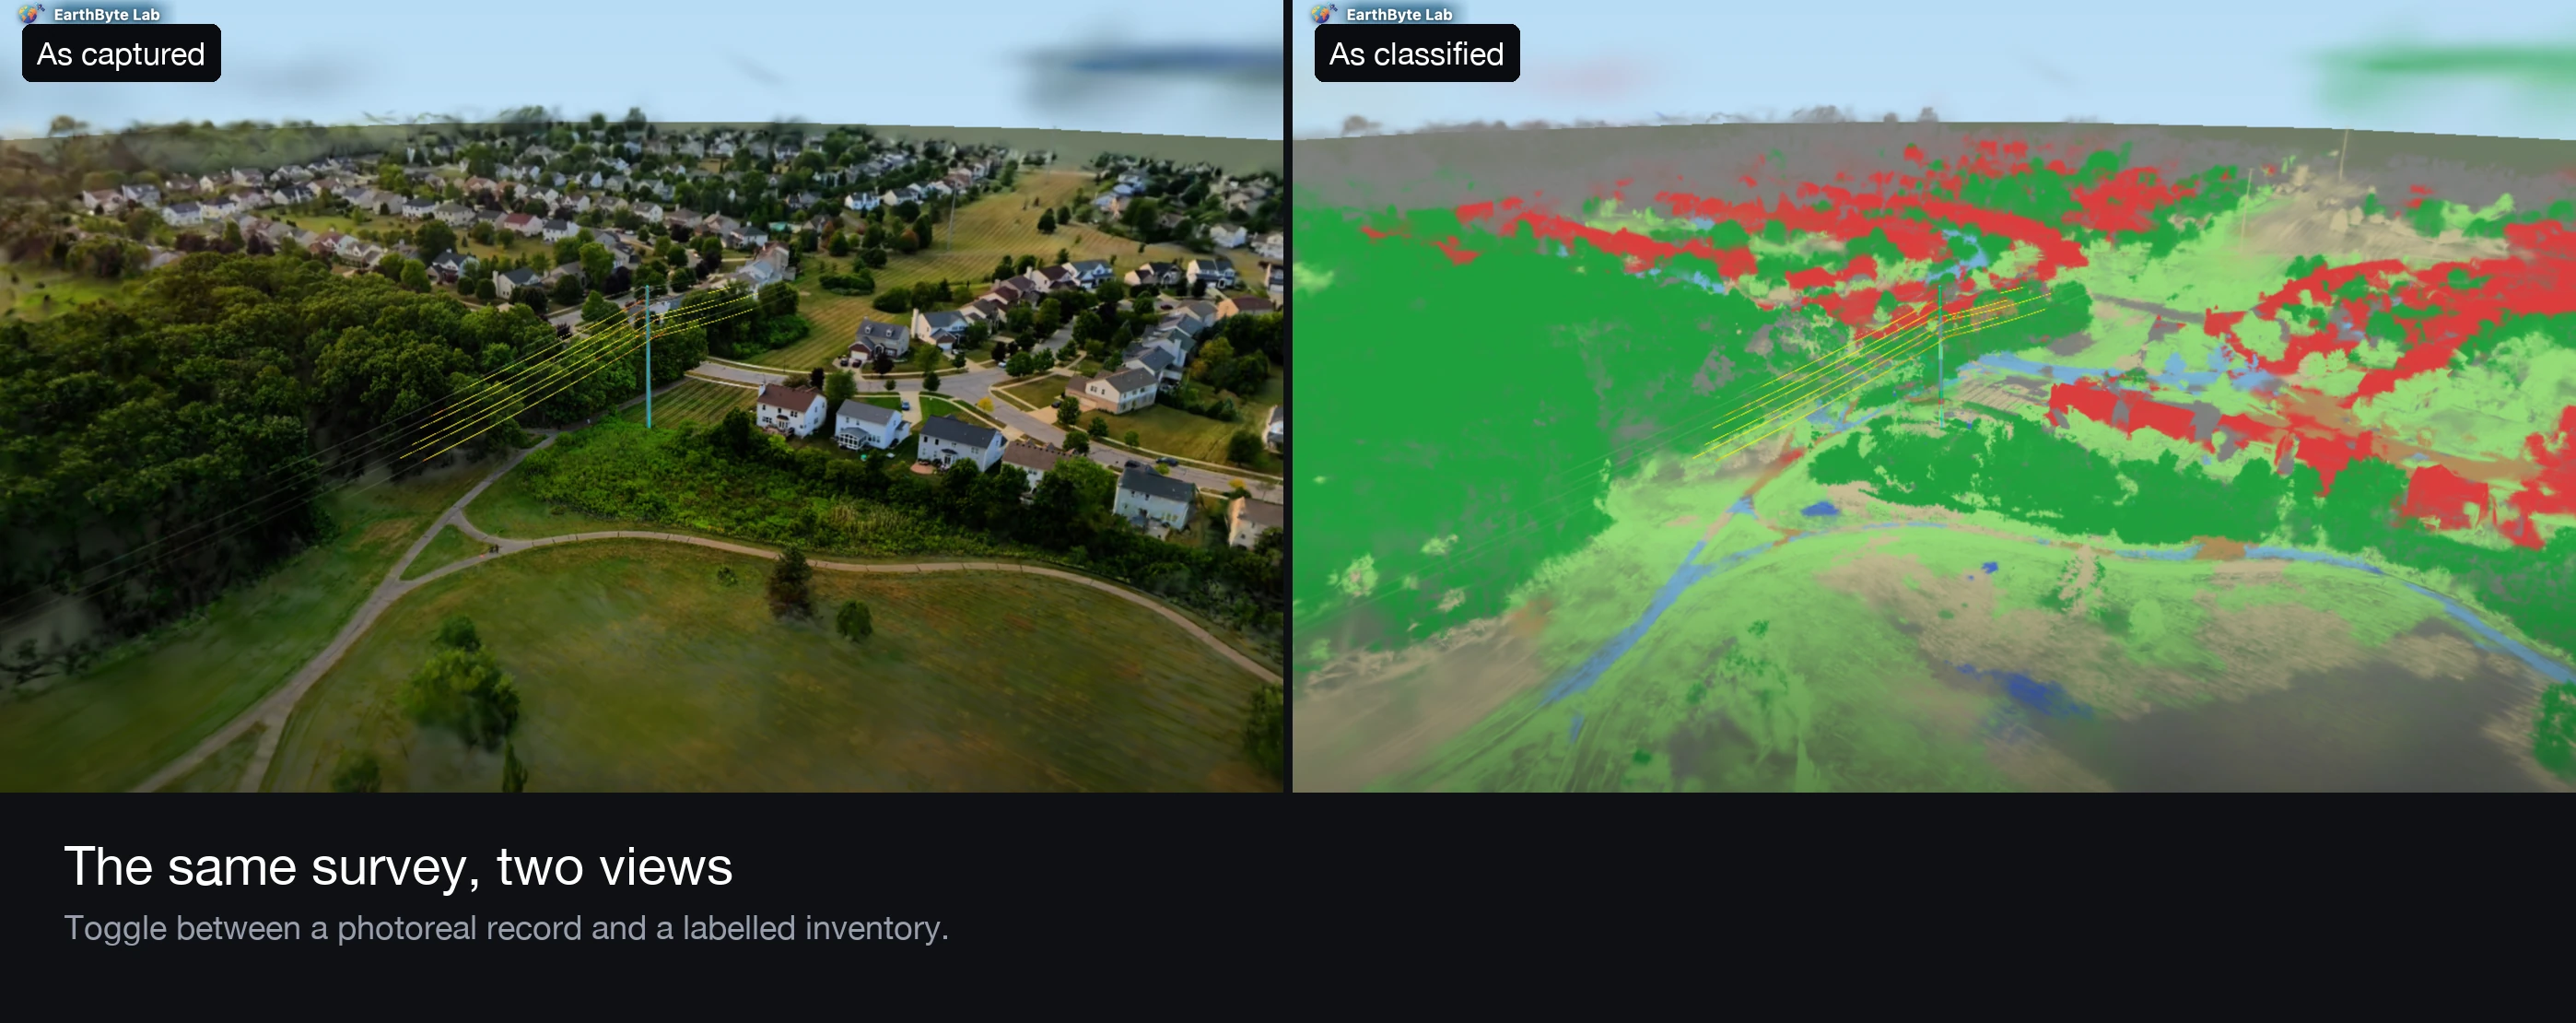
The left panel is what the site looks like. The right panel is what it is made of. Both are the same measurements, so they line up exactly. Field crews and executives look at the left. Planners and vegetation managers work from the right.
You switch between them in a browser. No plugin, no desktop software, no training.
Try it yourself
This is the live deliverable, not a video. Drag to orbit, scroll to zoom, and use the buttons in the corner to switch to the classified view or hide the wire overlay.
Explore here: splats.earthbytelab.com/0726power
Assets located and identified
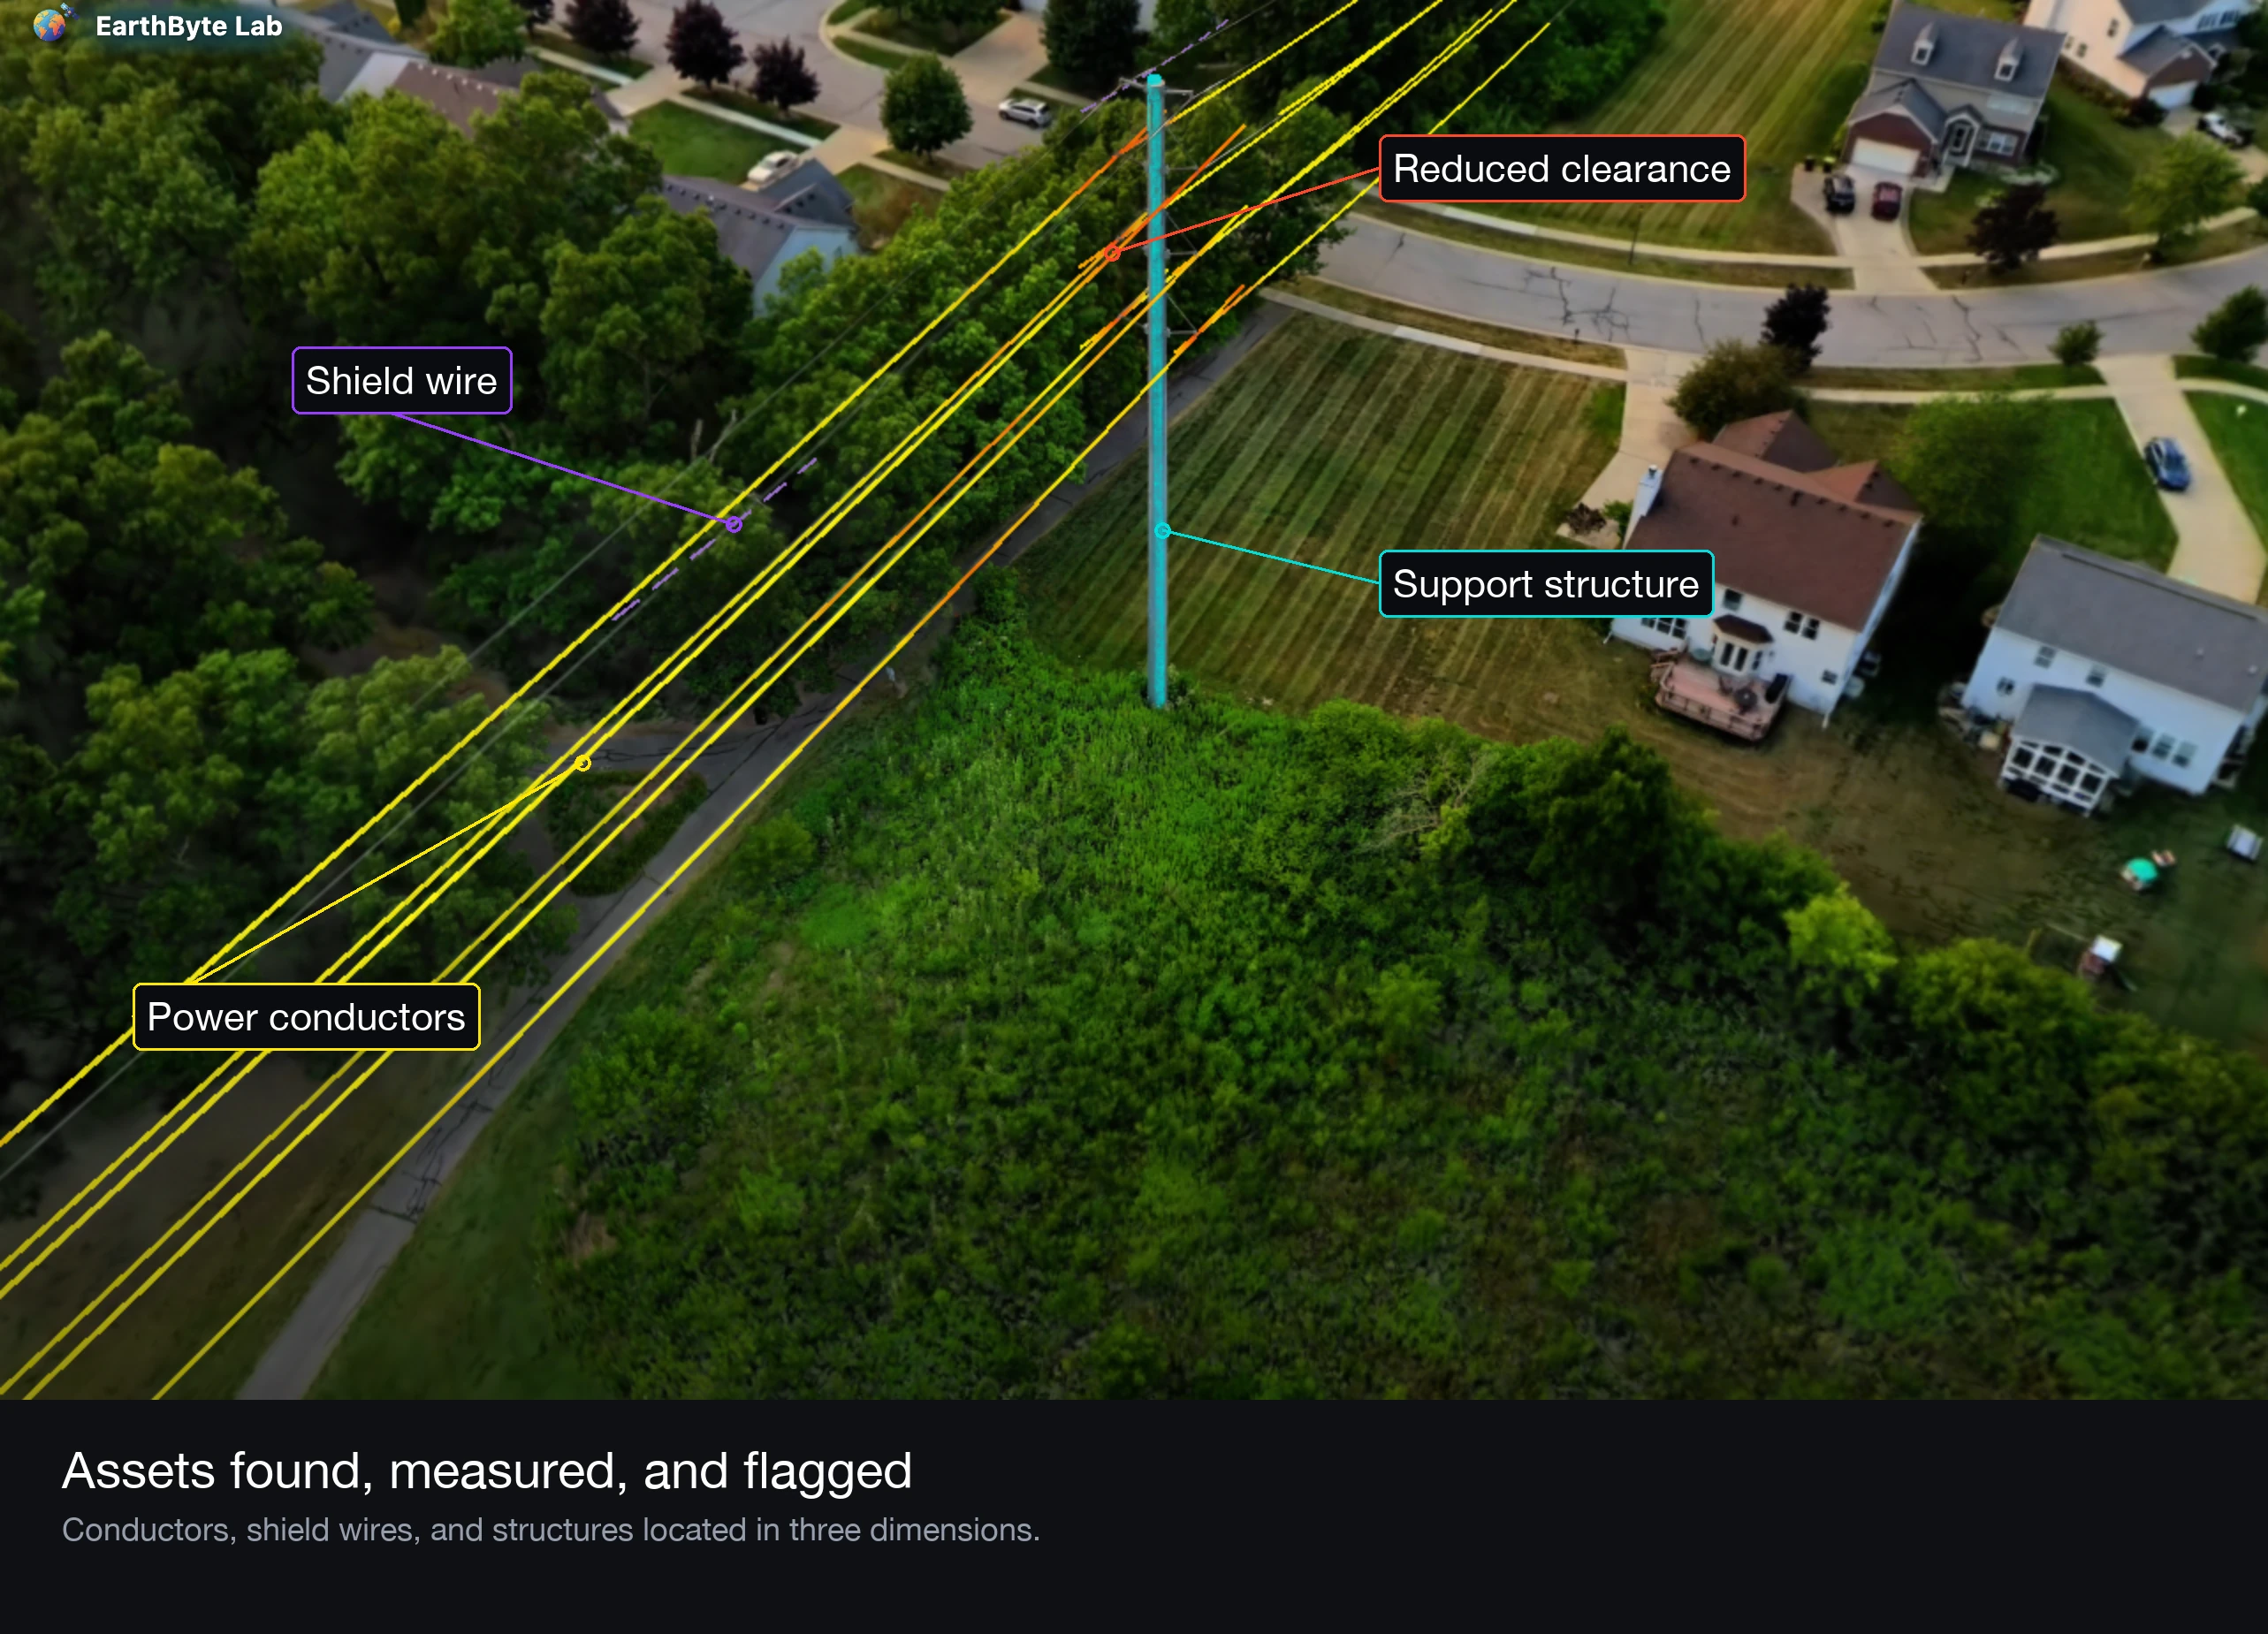
A photoreal model is a record. An inventory is a decision tool. We extract the second from the first.
Our system locates each conductor as a continuous three dimensional curve, not a cloud of loose points. It separates energised phase conductors from the grounded shield wires strung above them, because the two carry different risk. It finds the support structures and confirms their position against where the conductors converge, so every structure has two independent pieces of evidence behind it.
For this corridor the system found 14 conductors and the supporting structure from one pass.
Clearance in metres, with the confidence stated
The number a utility acts on is the gap between a conductor and the nearest vegetation. We report it per span, in metres, tied to real world scale rather than an arbitrary model unit.
We also report what the survey cannot resolve. Every measurement carries a resolution floor. Where the true clearance sits below that floor, we publish a bound rather than a number that looks more certain than it is. A planner needs to know whether a span has one metre of margin or five. Presenting an unresolvable value as a precise figure helps nobody.
We report a second measurement alongside it: the nearest vegetation growing beneath each conductor. Vegetation grows upward, so this is the encroachment that changes over a season.
What you receive
- A photoreal 3D scene, shareable by link, that opens in any modern browser
- A classified view of the same scene, toggled on demand
- Conductor geometry, structure positions, and clearance measurements as structured data
- A written report leading with the spans that need attention
Delivery is a URL. Your team opens it on a laptop in the office or a phone in the field.
Why this matters now
Grid operators face rising vegetation risk and tightening inspection expectations. The traditional options are a ground crew that is accurate but slow, or an aerial LiDAR contract that is fast but expensive and rarely repeated.
We sit between them. The capture is a single flight. The processing is automated. The cost profile supports surveying the same corridor again next season and comparing the two. Season over season change is where vegetation spending gets decided.
Honest limits
We publish these because they matter for planning a survey.
Photogrammetric capture measures the outer surface of the canopy. It does not see through dense foliage to bare earth the way an airborne laser does. For clearance to the nearest branch this is the right surface anyway. For canopy structure beneath a closed crown it is not.
Corridor length per flight is bounded by the capture pattern. Long transects need a flight plan built for them, and we scope that per site.
Sub metre clearance is not resolvable at every point on every span. We say so in the report rather than rounding it away.
The EarthByte Lab approach
We build measurement products, not renders. A pretty model that cannot be measured is a marketing asset. Our corridor deliverable carries scale, states its own uncertainty, and separates what was observed from what was inferred.
Ready to see your corridor this way? Book a consultation now
Contact us today to discuss utility corridor inventory and vegetation clearance surveys, and visit earthbytelab.com to get started.
Tagged
- 3D Gaussian Splatting
- Utility Inspection
- Vegetation Management
- Power Line Inspection
- Digital Twin
- Asset Inventory
- Aerial Survey
- Photogrammetry
- Clearance Analysis
- Grid Resilience
- Drone Survey
- Infrastructure